Diving into a CAD library with call tree analysis, Part 1
I’ve for a while been interested in taking on some kind of project involving 3D CAD. The difficulty in that is all of the futzy computational geometry, when what I’m interested in is developing compelling tools for engineers to use. This means I need a library, and ideally an open-source one so I can easily share my work. Luckily, I found Open Cascade Technology, or OCCT. It’s a fully-featured, battle-tested CAD library with 30+ years of development, and it’s available under the LGPL 2.1 license.
Learning to use large libraries is challenging. After several hours of trying to figure out what the built-in examples were doing, I didn’t feel very close to being able to do anything. In particular, I just didn’t know where you were supposed to start with the library. How do you make CAD with it?
In trying to understand what the examples were doing, I found myself tracing the execution of a functions up and down the project. It was very tedious and I wanted to get a big picture faster. I realized that if I could sample the current execution stack at some frequency across a usage session and plot which functions called which, that could get me more understanding faster.
I tried to see if this was possible, and I learned about catchpoints in GDB. They are breakpoints which stop program execution every time some event occurs, here a system call. This was be my sampling method. I could save the execution stacks to a file, parse them, and then plot them.
The experiment I ran was to run the DRAWEXE example, render a drill bit, rotate the camera around a bit, and then close the application. To set up, I launched gdb as so.
# before this, I made a debug build
$ . env.sh d # this sets up the OCCT environment to run debug builds
$ gdb DRAWEXE
(gdb) set logging redirect on  # don't write output to the terminal
(gdb) set logging file occt_syscall.txt  # write it to a file
(gdb) set logging enabled on  # and commit these changes
(gdb) catch syscall  # break execution on every syscall
(gdb) commands  # run these commands when it stops
backtrace  # record the execution stack
continue 100  # continue execution and only stop again after 100 syscalls
#        ^ this for performance, it's uselessly slow without
end
(gdb) run  # start the experiment
This produced a 3.7 MB data file. The stack traces generally looked like this.
#0  __lseek64 (fd=3, offset=0, whence=0) at ../sysdeps/unix/sysv/linux/lseek64.c:40
#1  0x00007ffff7693317 in _IO_new_file_seekoff (fp=0x5555555c9260, offset=0, dir=<optimized out>, mode=<optimized out>) at ./libio/libioP.h:1030
[...]
#13 0x00007ffff7f24cc9 in Draw_Main (argc=1, argv=0x7fffffffd2e8, fDraw_InitAppli=0x5555555551a9 <Draw_InitAppli(Draw_Interpretor&)>) at /home/fp/3rd/OCCT/src/Draw/Draw_Main.cxx:111
#14 0x000055555555520b in main (argc=1, argv=0x7fffffffd2e8) at /home/fp/3rd/OCCT/src/DRAWEXE/DRAWEXE.cxx:359
At the bottom, there is main, which was the entry point for the program, a chain of 14 different functions call each other with the presented arguments, and it terminates in a call to the OS’s __lseek64 function, which apparently opens a file.
This data needed to be massaged into something useful that I could plot. I decided I would do the plotting with Mathematica since it has some nice graph plotting functions.
I did the parsing with Python. It was built with a fairly large regular expression with named groups that I could pull the results from. The regex was built by starting with a small number of stack trace lines to parse, adjusting the expression until it matched all of them, and then doubling the number of trace lines and repeating until all the trace lines matched the regular expression
import re

valid_line_re = re.compile(r"^#\d+ .*$")
trace_element_re = re.compile(
    r"""
    ^
     \#(?P<Number>\d+)[ ]+
     ((?P<Address>0x[\da-f]+)[ ]in[ ])?
     ((?P<Symbol>
       (llvm::Pass\*[ ])?  # weird compiler stuff
       (\?\?|[a-zA-Z_][a-zA-Z0-9_:.~]+  # regular text symbols
       (<([^<>]|<([^<>]|<[^<>]*>)*>)*>|\([^()]*\))?)  # nested templates
       (::~?\w+)?  # methods on templates or ??
       ([ ]new|\(\)|\[\])?  # operator overloads
     )[ ]
     \((?P<Args>([^)]|\"\(\"|\([^)]*\))*)\)
     ( (at|from) (?P<Path>.*))?|\?\? \(\))
    $
    """,
    re.VERBOSE
)

for line in occ_syscall_txt.split("\n"):
    if re.fullmatch(valid_line_re, line):
        matches = re.search(trace_element_re, line)
        number = int(matches.group("Number"))
        symbol = matches.group("Symbol")
        # collect the rest and put it in a data store
# write the data to a file as a Mathematica expression
valid_line_re is simple enough, it just detects if a line represents actual data instead of garbage that the debugger emitted (which was quite a lot). trace_element_re is more complex, largely to parse the symbol. It had to handle nested templated symbols like OSD_Parallel::For<BOPTools_Parallel::Functor<NCollection_DynamicArray<BOPAlgo_FaceFace> > >, operator overloads like NCollection_SeqNode::operator new, some odd symbols had parenthesis, and there were odd compiler-generated symbols that started with llvm::Pass*. There were a lot of odd cases to deal with, but it worked correctly for the roughly millions of lines of data that had to be parsed.
In Mathematica, I assembled a graph by drawing an edge from a caller to a callee, then put all these edges into a big list and removed the duplicates. Then I plotted it with a layered digraph embedding since it uniquely generated output that didn’t look like mush.
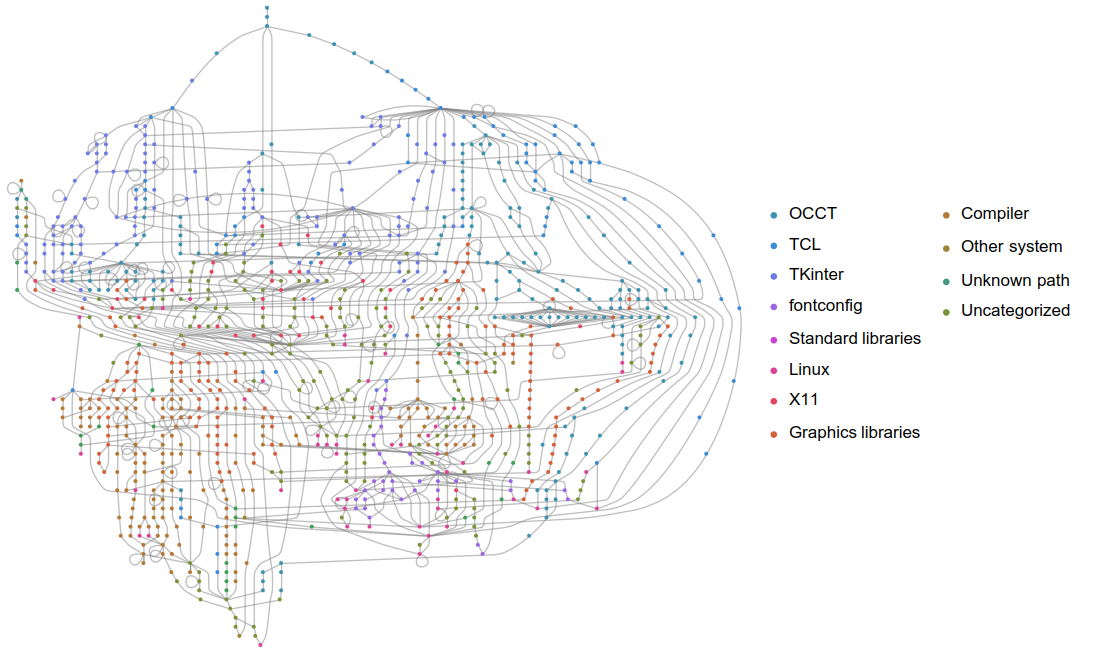
Figure 1: The high-level functions like main and event handlers are at the top and are colored in blues. Much of the top-left is event handling, the right is multi-threading and graphics. In reds toward the bottom are system libraries. Very interesting is that the fontconfig library is at the bottom; indeed it regularly calls libc directly.
This gave really good view into how OCCT interacts with external libraries. This could be a useful reference for ways to make the library leaner. But it doesn’t give much insight into the library’s internals since it’s primarily a math library, and math libraries don’t do many system calls. In the next blog post, I’ll write about how callgrind can be used to study a library’s internals.
Thought that was interesting? Let me know by emailing me.